You’re in a big winning crypto trade. Your open profits continue to increase every day. Congratulations! But do you know exactly why and when to exit winning trades, before the smart money help themselves to some, or even all, of your hard-won gains?
This article will demonstrate several prime, low-risk profit-taking setups that can help you predetermine your trade exits before it becomes obvious to the herd. By exiting ahead of the crowd, you’ll be able to retain far more of your open gains. You’ll also experience less stress and spend less time in the market, thus reducing your risk exposure.
Strategy #1: Using Price Cycle Bar-Counts in Conjunction with Support/Resistance and Price/Momentum Divergences (Long Trades)
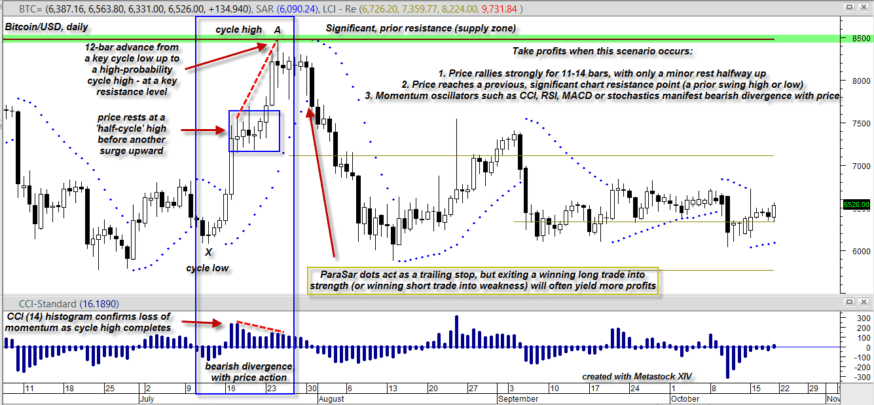
Most liquid (high trading volume) crypto markets run on a 16-24 bar price cycle (measured from trough to trough, the average usually being 18-20 bars). By plotting a double stochastic oscillator on your charts, you can visually anticipate where the next tradable cycle low may appear. This accurate technical indicator can give you added confidence in entering/exiting your trades. In the trade example below, I’ve identified a valid cycle low at X in BTCUSD’s daily chart. Price accelerates higher in the next four bars, consolidates for several more, and then makes a final surge up to point A. There are several cycle dynamics at work here that you need to internalize:
- In a bullish cycle, markets typically rise 5 to 7 bars from the cycle low before temporarily stalling/pulling back (blue rectangle).
- If price again rallies again after the stall, expect the complete rally up from the cycle low to stall once again after 11-14 price bars.
- If the 11-14 bar move stalls at a previous, strong resistance zone (red line on chart) and you see momentum oscillators such as the Commodity Channel Index (CCI (14)) manifesting negative divergence with price action, you need to exit your winning trade immediately.

Figure 1.) Bitcoin/USD, daily. Using a knowledge of cycle bar counts and other technical indicators can alert you to prime profit-taking exits – before the rest of the crowd. Chart graphic: Metastock.com
After a strong 11-14 bar rally (one with no discernible reversals along the way), the probability of further gains is extremely low. So, once price accelerates higher out of the first stall zone, begin to scale-out of at least a third of your open gains once bar 10 is reached, take the next third off by bar 11, and by all means be completely out of the trade and into cash before price runs smack into a major resistance line.
Key Takeaways:
- Always know the current cycle bar count; most crypto markets will stall/reverse after a strong 11-14 bar rally.
- Know where the key resistance (supply) zones are in the coins you trade; these are usually high-probability stall/reversal price areas.
- Be aware of developing price/momentum divergences in reliable oscillators such as the Commodity Channel Index or CCI (14), particularly after a strong 11-14 bar rally toward a key resistance zone.
- Using these three tools will enable you to determine high-probability trade exit points well in advance of the herd. Exit winning trades before your open gains become a target for hijacking!
Strategy #2: Selling into the Strength of a Late-Stage, Parabolic Rally (Long Trades)
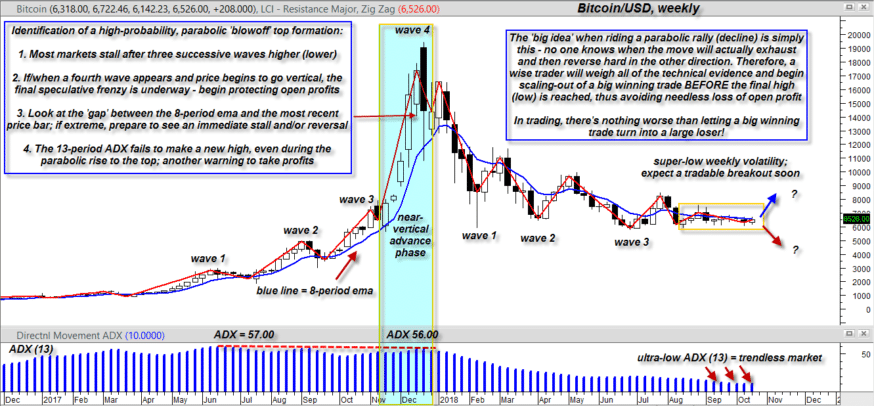
Most cryptos tend to move in three successive, sustained waves. Then comes a trend reversal or major consolidation phase. The late December 2017 thru October 2018 price action in BTCUSD’s daily chart depicts this well:

Figure 2.) Bitcoin/USD, weekly. Most strongly trending markets will stall/reverse after three successive, powerful waves. When a fourth wave appears and price begins to accelerate, you need a plan for harvesting windfall gains. Chart graphic: Metastock.com
Note that the three primary waves were lowering since the beginning of 2018. A fourth wave commenced, but it failed to take out wave three’s low, and the price has been consolidating for several months now.
But now glance at the left side of the chart: three powerful bullish waves printed during March – October 2017, but then after only a minor pullback, a fourth wave appeared. This monster wave of buying rose at a near-vertical pace for six weeks. This speculative mania-fueled rally resulted in a predictable blow-off top/reversal in mid-December 2017. Here’s how to profit and also protect open gains, should you ever be caught up in a near-vertical parabolic rally:
- Once price surges above the wave three high, begin to monitor the relation of price to the blue eight-period exponential moving average (EMA) line. As price stretches further and further above the line, begin to take a third of your open gains and use the line as your trailing stop.
- Monitor the level of the 13-period Average Directional Index or ADX (13) histogram. Readings above 50 are extreme, except in a parabolic rally. Look instead for price/momentum divergences between ADX and price. Note how ADX failed to make a new high even as Bitcoin zoomed upward. This was a clear indication to book even more, if not all of your open gains.
- Finally, the pullback after the wave two high was a defacto weekly cycle low. Price rallied for eight bars, stalled at wave three’s high, pulled back slightly and then began a six-bar, near-vertical advance. That’s a total of 14 price bars higher from the cycle low. Remember the 11-to-14 bar rule discussed earlier? By bar 11, a wise trader would have aggressively scaled out and by bar 12 would have grabbed all open gains and run for the hills. Compare that exit strategy to that of most retail traders, who believed that the sky was the limit.
Key Takeaways:
- A strong surge above a wave three high may be signaling a developing parabolic rally.
- Keep track of the relationship between the blue eight-period exponential moving average and price itself. Extremes may be warning that the rally is nearly complete.
- Monitor the 13-period ADX for price/momentum divergences. Failure of ADX to make a new high along with price is a clear exit signal.
- The 11-14 price bar rule is also a very powerful ally in the fight to retain open gains. Never expect a market to rally significantly after 11-14 bars. Take your profits and move back to cash.
Strategy #3: Using Cycle Timing to Exit Short Trades into Strength
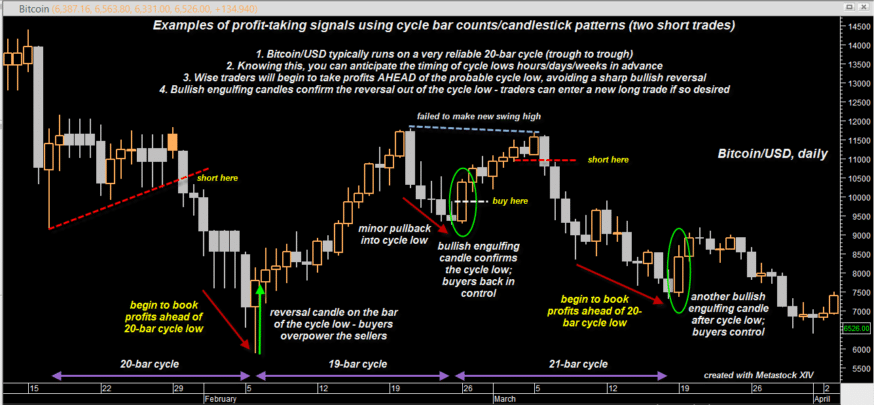
The daily candlestick chart for Bitcoin/USD clearly reveals a recurring 19-21 bar cycle count (trough to trough). At times this cycle can extend to 24-26 bars, or even shrink to 14-16 bars, but will generally average around 18-20 bars in duration.
Let’s say you went short on a trendline break in late January 2018, and you already knew that a high-probability cycle low was due to make its appearance on or about February 6th. The price dropped very quickly, offering you a nearly 20 percent gain by February 2nd, so what would a wise trader have done then? See the chart below for some hints:

Figure 3.) Bitcoin/USD. Smart traders use their knowledge of cycle forecasting to help time their exits, taking profits ahead of the herd. Bullish reversal candlesticks confirm cycle lows but are poor short trade exit signals. Chart graphic: Metastock.com
The cycle bar count was at 16 on February 2nd. At that point, you had open gains of 20 percent, so the wise move would have been to take at least half the open gains by bar close. Then as bars 17-20 developed, there was one final opportunity to harvest final gains before the cycle low formed. Could the price have fallen further, with the cycle low extended to a later date? Yes, but why would you take the chance of risking open gains on such a low-probability outcome?
Once Again
A similar short trade setup sits on the right side of the chart. The cycle timing and profit-taking dynamics worked in exactly the same way. By the way, the shallow pullback long entry in the middle of the chart also occurred after a confirmed cycle low. Shallow pullbacks into a cycle low occur in a bullish cycle phase and deep ones occur in bearish cycle phases. The more you work with cycles in the same coin, the easier it will be for you to identify low-risk buy and sell short setups.
Key Takeaways:
- Tracking the average cycle length in every coin you trade gives you a powerful trading edge.
- When a winning short trade’s cycle length has reached 15 bars, prepare to take around half of your profits.
- As the cycle progresses thru bars 17-20, you need to scale completely out of your winning short trade.
- Shallow pullbacks into cycle lows typically occur in bullish cycle phases. Deeper pullbacks into cycle lows occur during bearish cycle phases and/or major, bullish trend reversal setups.
Summary
Knowing how to exit winning trades can be as much art as it is a cold, mechanical process. But a deep knowledge of cycle timing and other technicals will help you wring the maximum gains from your winners. This knowledge will prevent a large winning trade from turning into a mediocre winner, or even a losing trade. That is an event that no skilled trader should ever need to experience.
Harvest gains before your competition does, and you’ll have what it takes to consistently profit in the crypto markets.
Disclaimer: Speculation in the financial markets involves substantial risk and therefore only risk capital should be used when trading or investing. Always consult your licensed financial advisor before deploying risk capital in the financial markets.
Related
Maybe you already know you can do it in our channel. Telegram to share operations with other users:
Subscribe to the channel to find out all the latest news!
https://t.me/Guadagnare_sul_Forex
Subscribe to the Telegram group!
https://t.me/Guadagnaresul_Forex
It is important, in the group to interact with all investors to earn on Forex and know the investment strategies.
See you soon and good trading!
Earn on Forex


